
Welcome
Welcome to rgraphs.com, a broad collection of templates to make the creation of graphs a lot quicker and easier using the r programming language. Our visualization tool of choice is ggplot2. However, other packages are also used when needed.
- Plot Means and Standard Deviations in R ggplot2
 Mean values and standard deviations (SD) can easily be plotted using the ggplot2 package in R. The same approach can also be used to plot…
 - Boxplot Without Whiskers Using R GGplot2
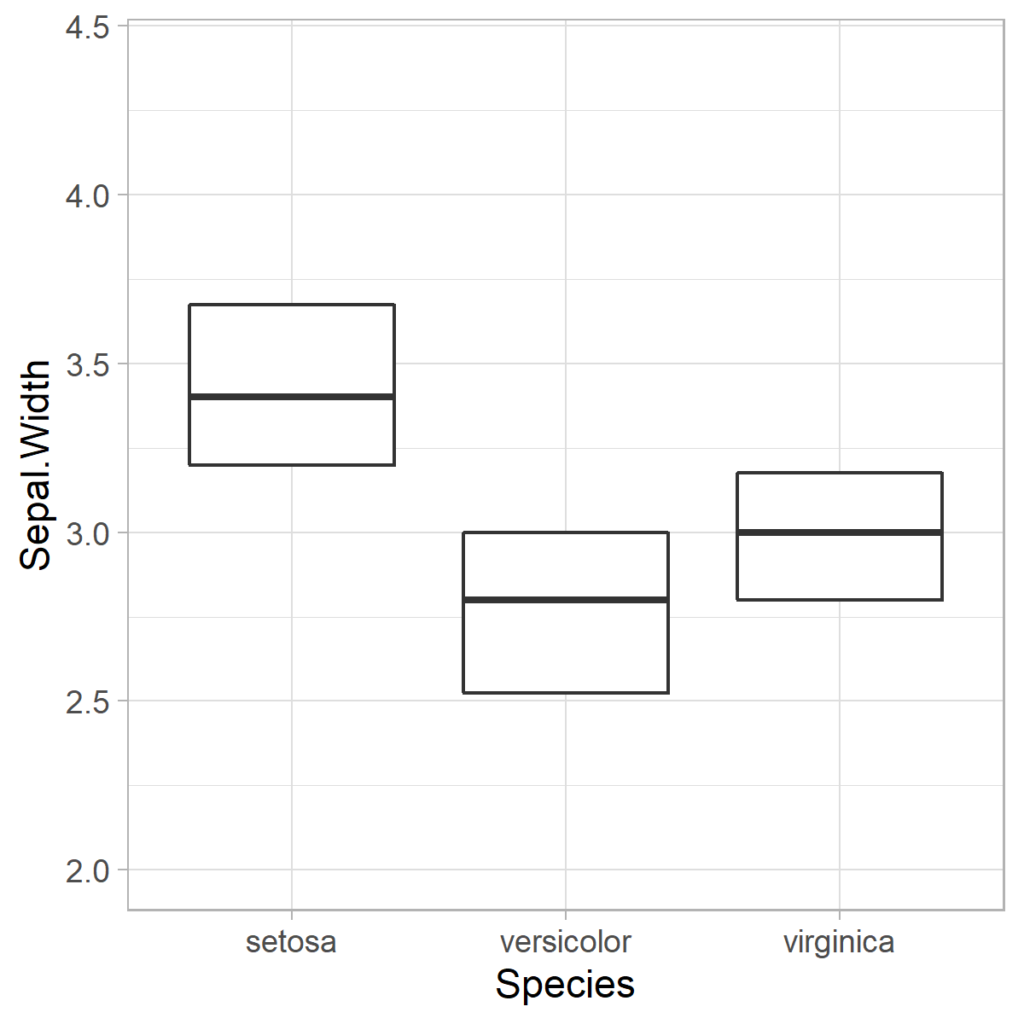 Two methods are presented below to create a boxplot without whiskers in the R GGplot2 package. The first method is used when the boxplot is…
 - High Quality Forest Plots in R GGPLOT2
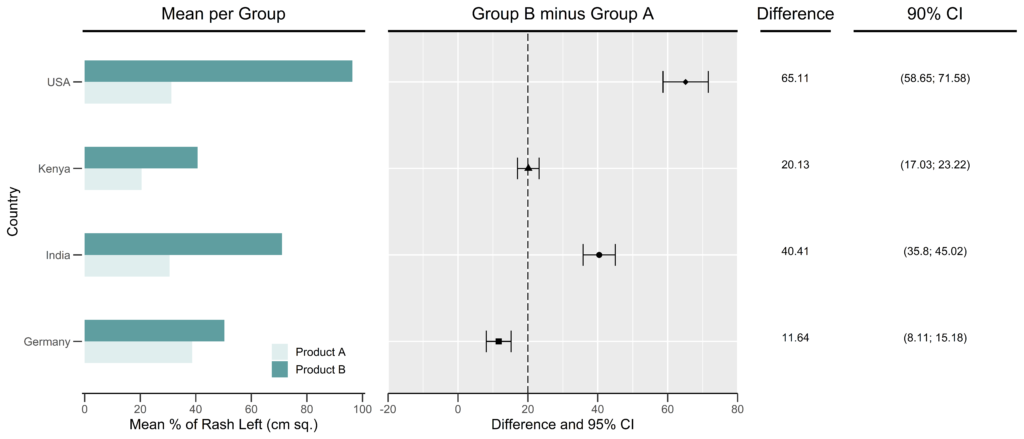 A forest plot is a very efficient way to present the results of an analysis that compares two groups for several populations or subgroups. It…
 - Combine Plot and Table in R GGplot2
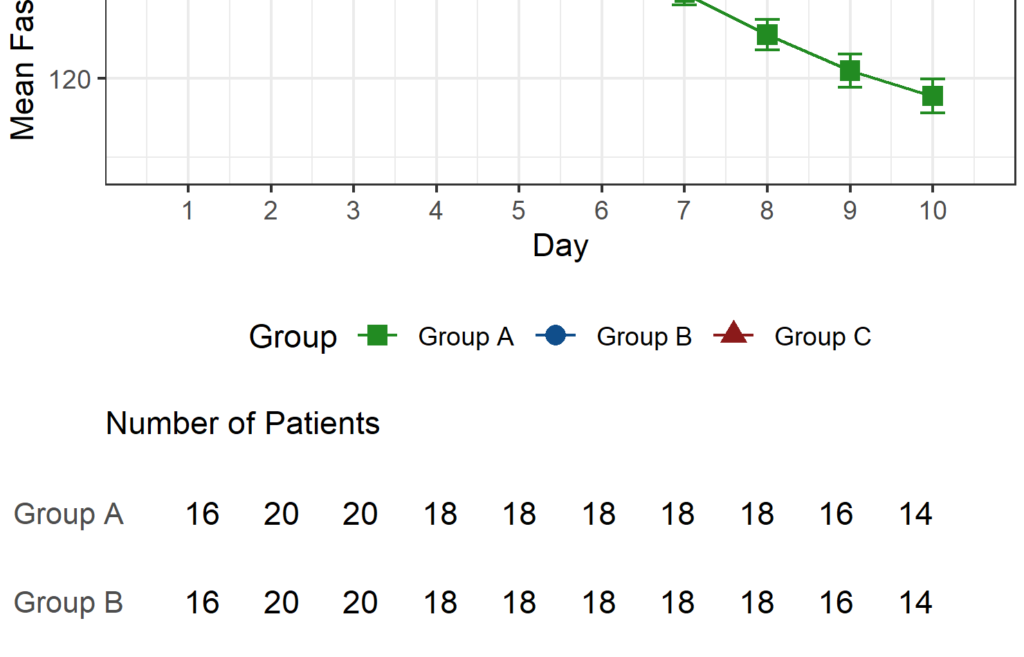 When presenting data on a plot, it is sometimes useful to also show a table with the actual numbers next to the plot. In some…
 - Annotate with Geom_text in GGplot2
 The function geom_text() can be used to annotate on graphs in GGplot2. Geom_text() uses data frames to annotate. Other functions such as annotate() can also…
 - How to Annotate on a Graph with R GGplot2
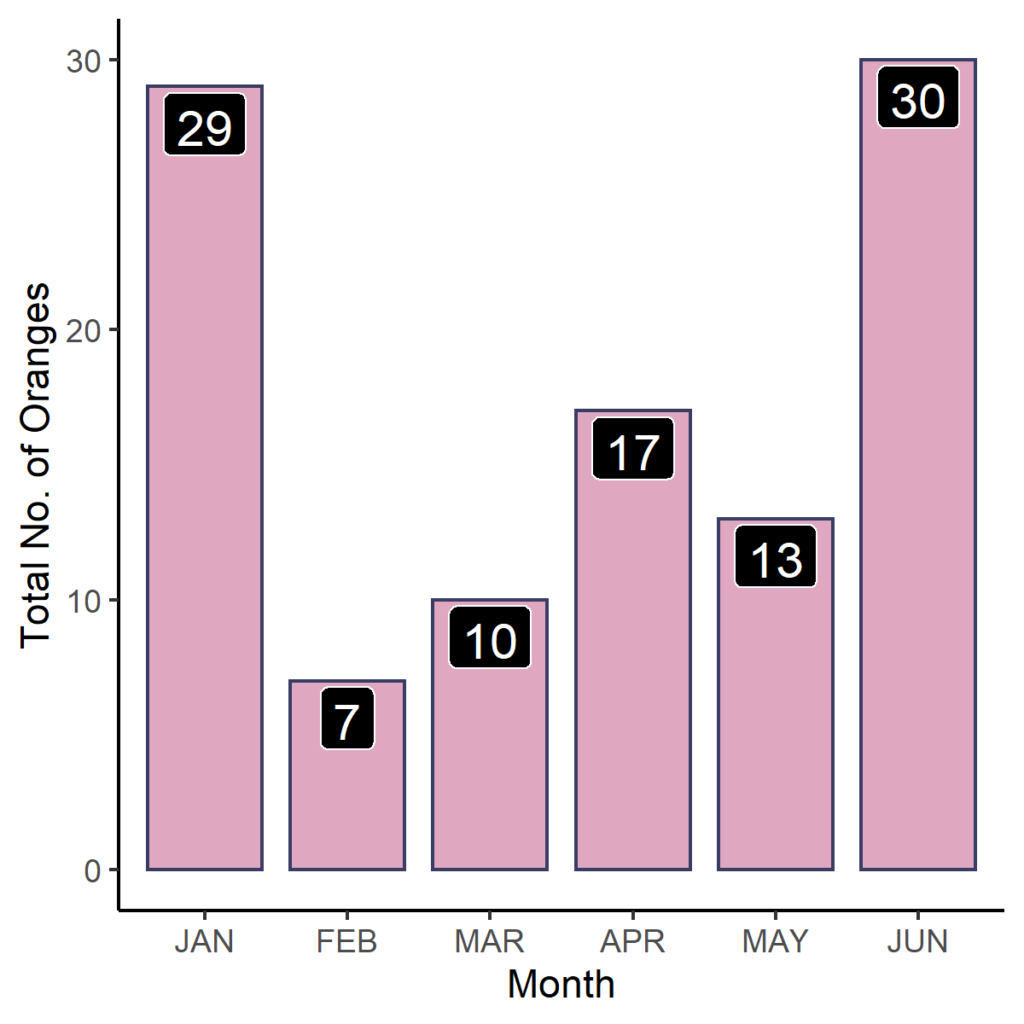
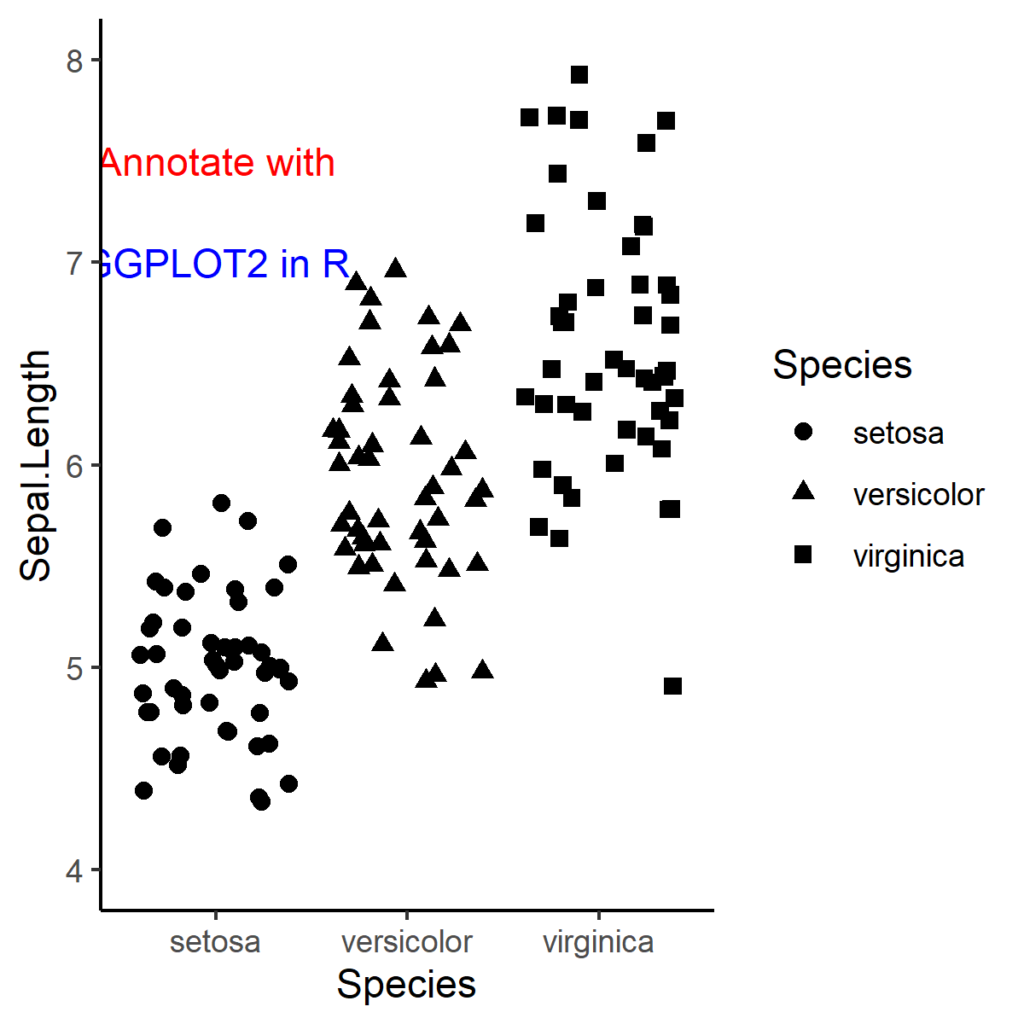 Functions such as annotate() and geom_text() can be used to annotate a graph in GGPLOT2. This article focuses on the annotate() function which uses data…
 - Bar Graph with Error Bars in R
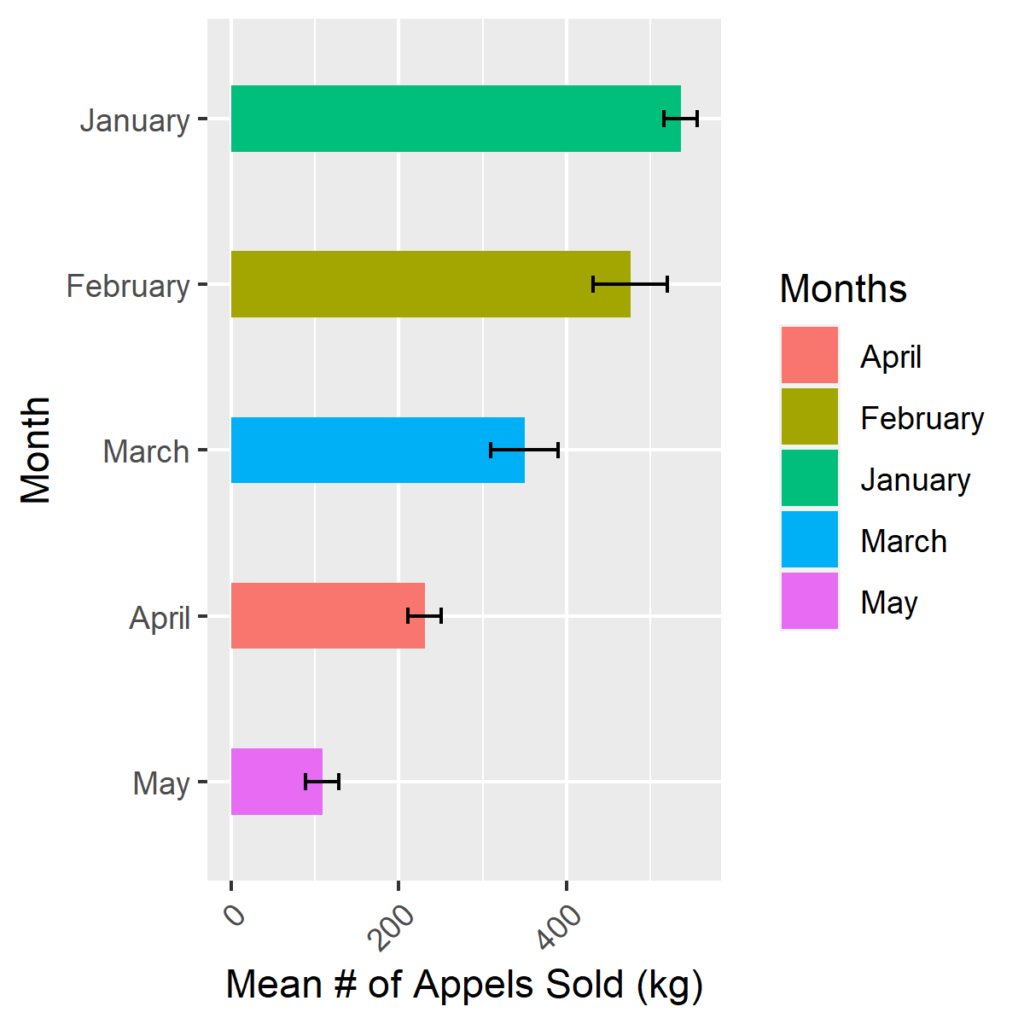 The Ggplot2 package can be used to create a bar graph with error bars. The geom_bar() function can be used to create the bar graph,…
 - Stacked Column Chart and Clustered Column Chart in R GGplot
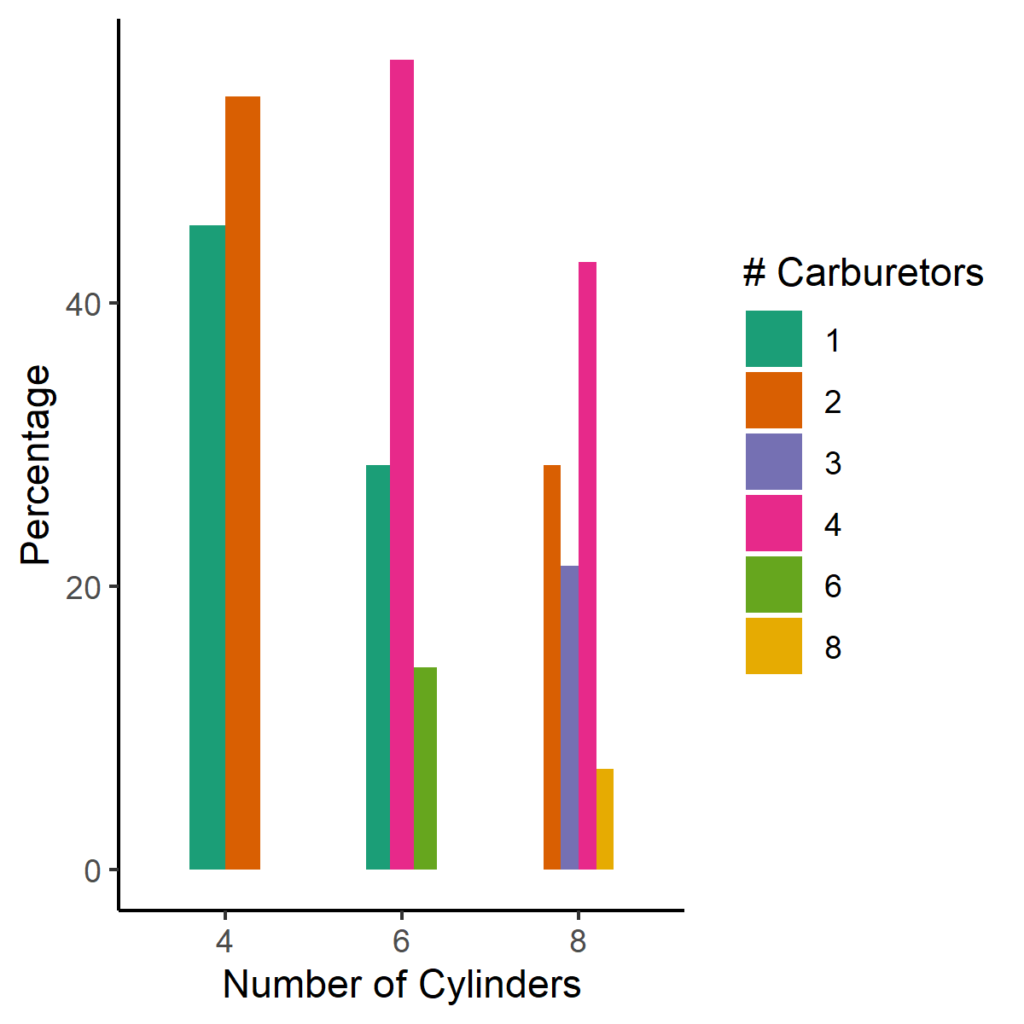 Stacked Column Chart A stacked column chart also known as a stacked bar chart is a type of bar graph that stacks the categories of…
 - Forest Plot in R
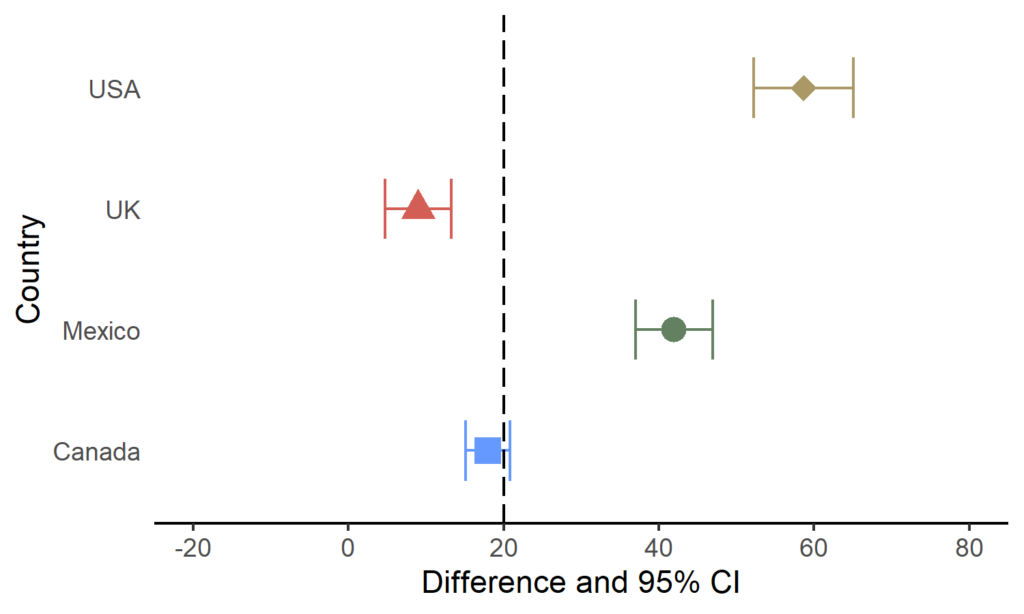 Forest plots are useful when conducting meta-analyses, to visualize the results of multiple scientific studies in a single graph. Forest plots are also commonly used…
 - How to Create Dummy Data in R
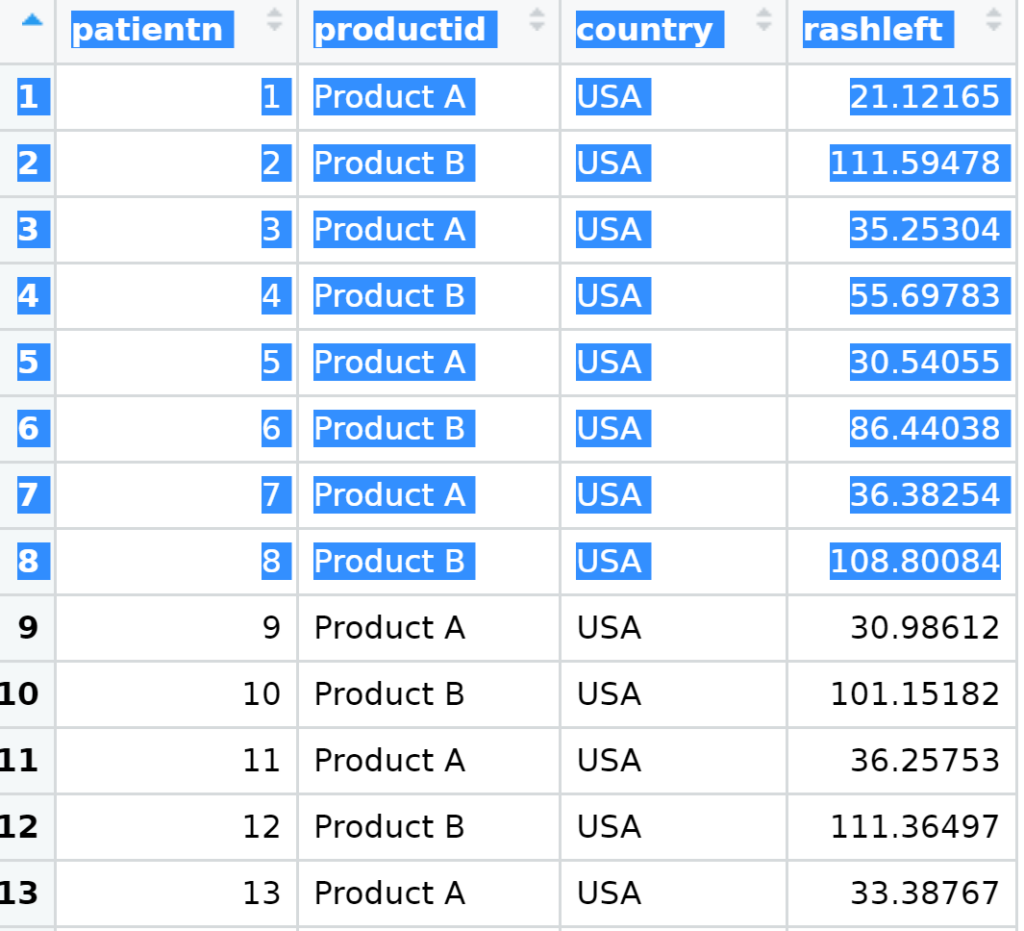 What is a Dummy Data? Dummy data are used to simulate real data. In the absence of real data, dummy data can be used to…
 - How to Fix the Error: Mapping Must be Created by aes() in GGPLOT2
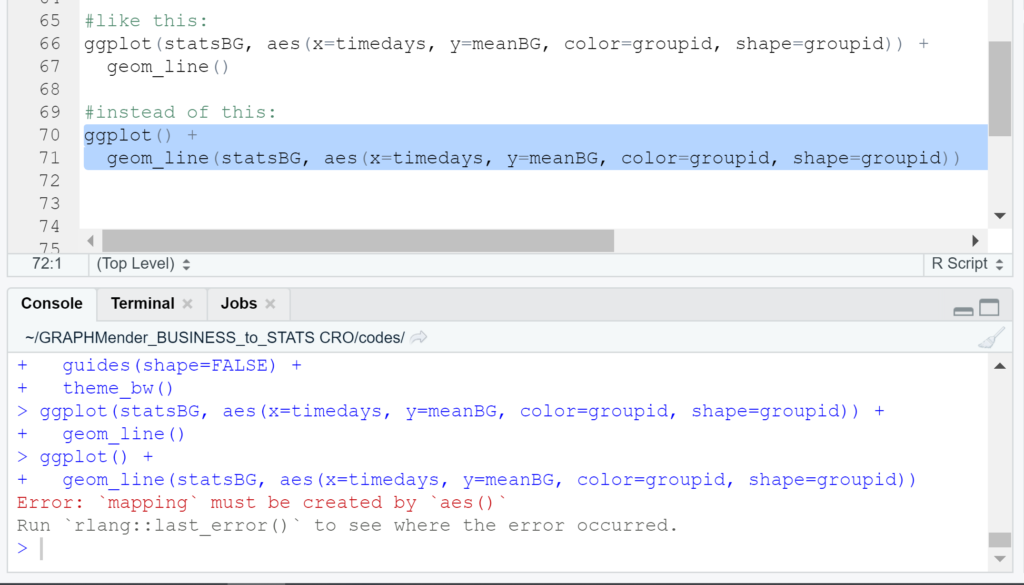 “Error: mapping must be created by aes()” is an error you would eventually run into if you frequently use GGPLOT2 to create graphs in R….
 - Mean Profile Plot in R
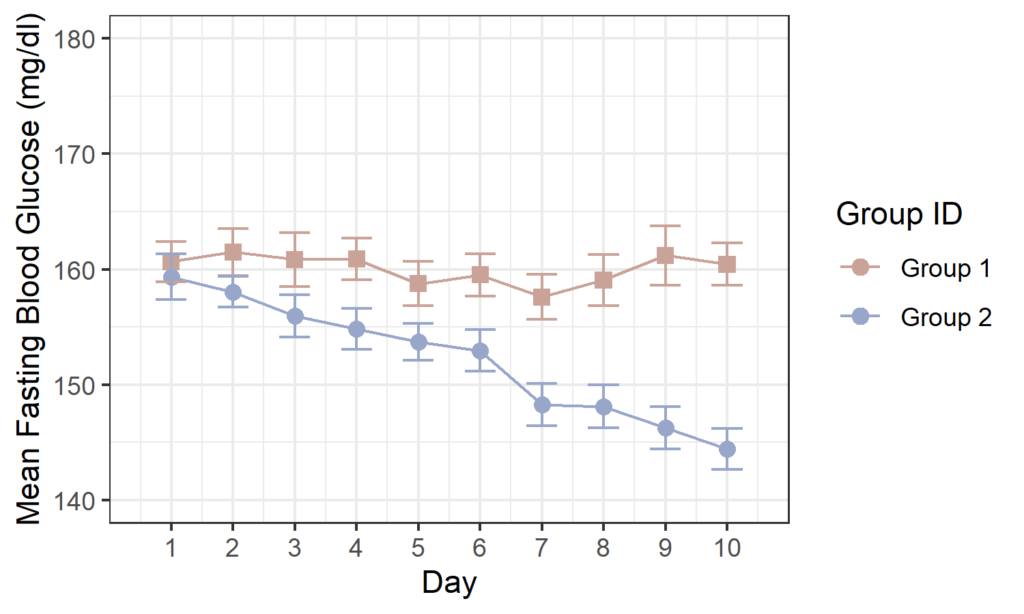 A mean profile plot is used to visualize the evolution of a variable measured over time. In a previous, we used a dataset of blood…
 - Visualizing Longitudinal Data
 Longitudinal data is data collected repeatedly from the same subjects or objects over a period of time. The data collection times may or may not…
 - How to Plot a Line Graph in R with GGplot2
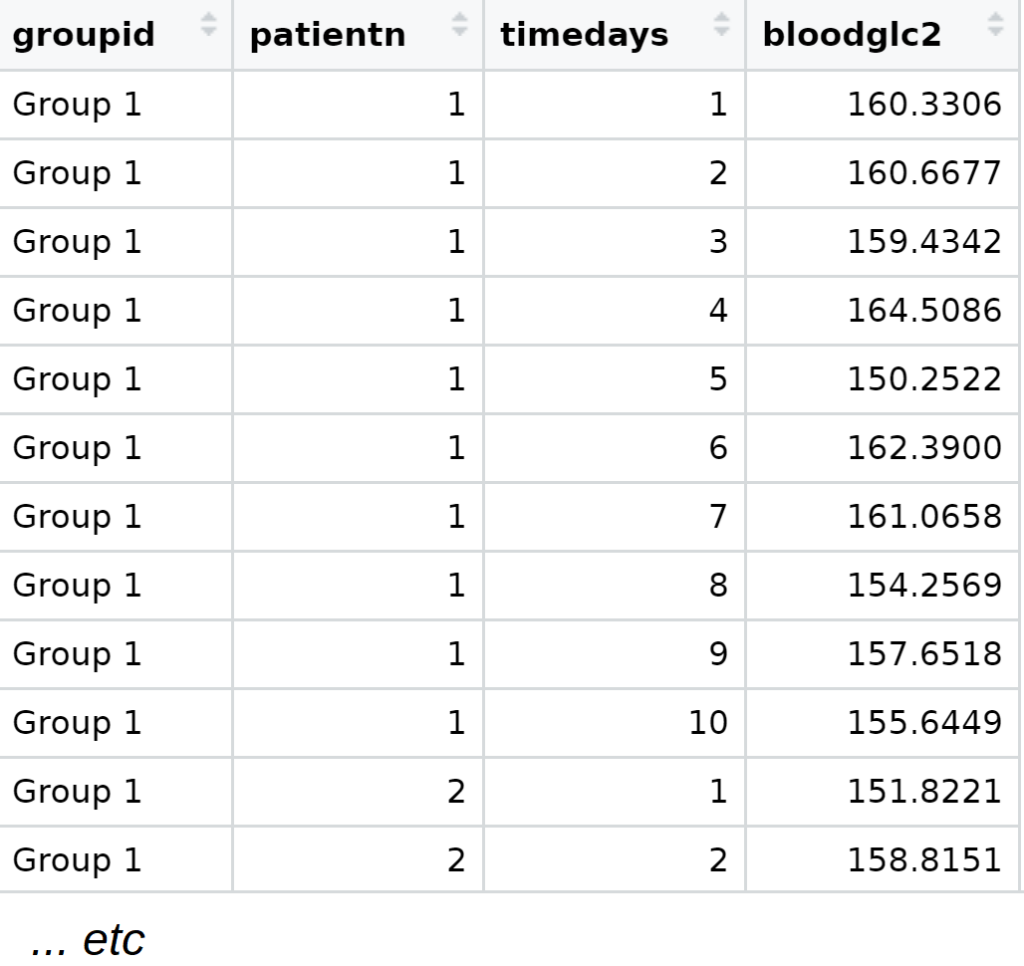
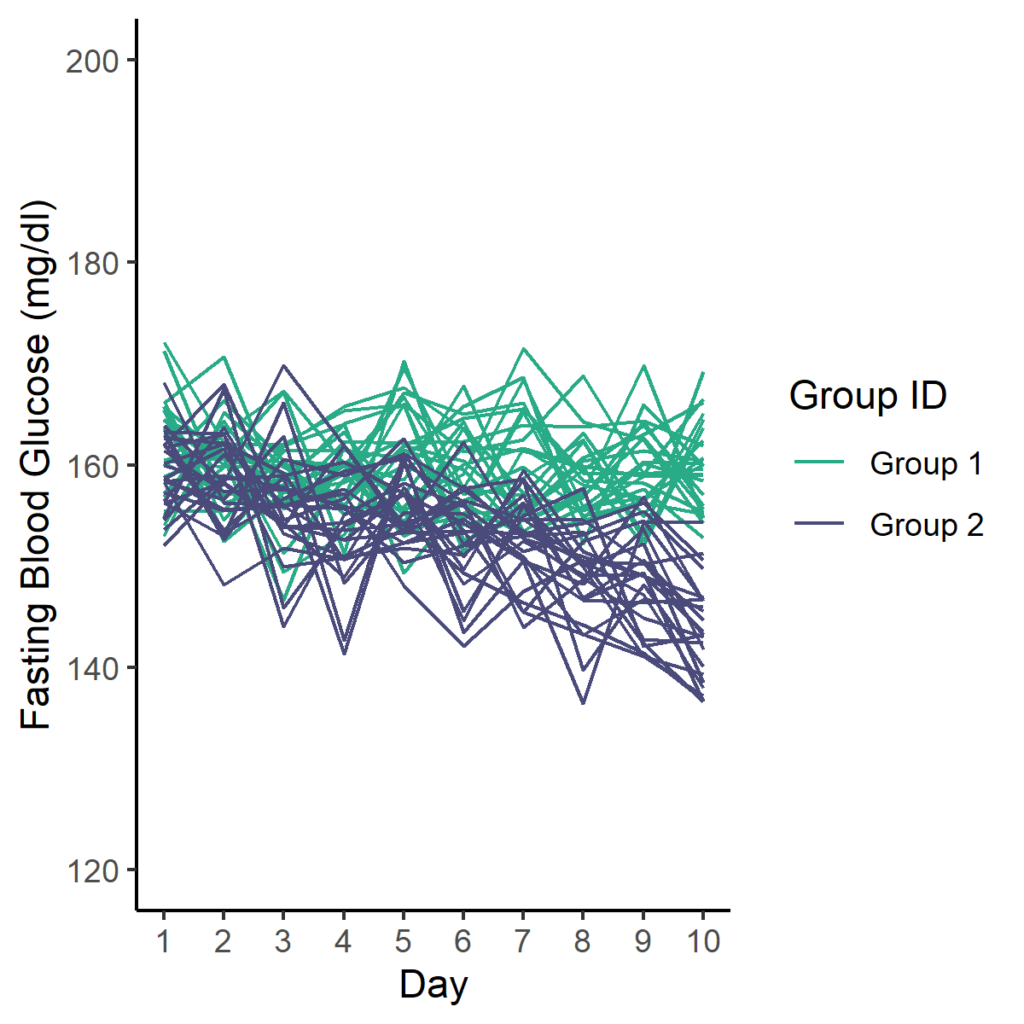 A line graph or line plot is a type of graph typically used to visualize longitudinal data. Assume we had a longitudinal dataset consisting of…
 - How to Create a Cumulative Frequency Graph in R
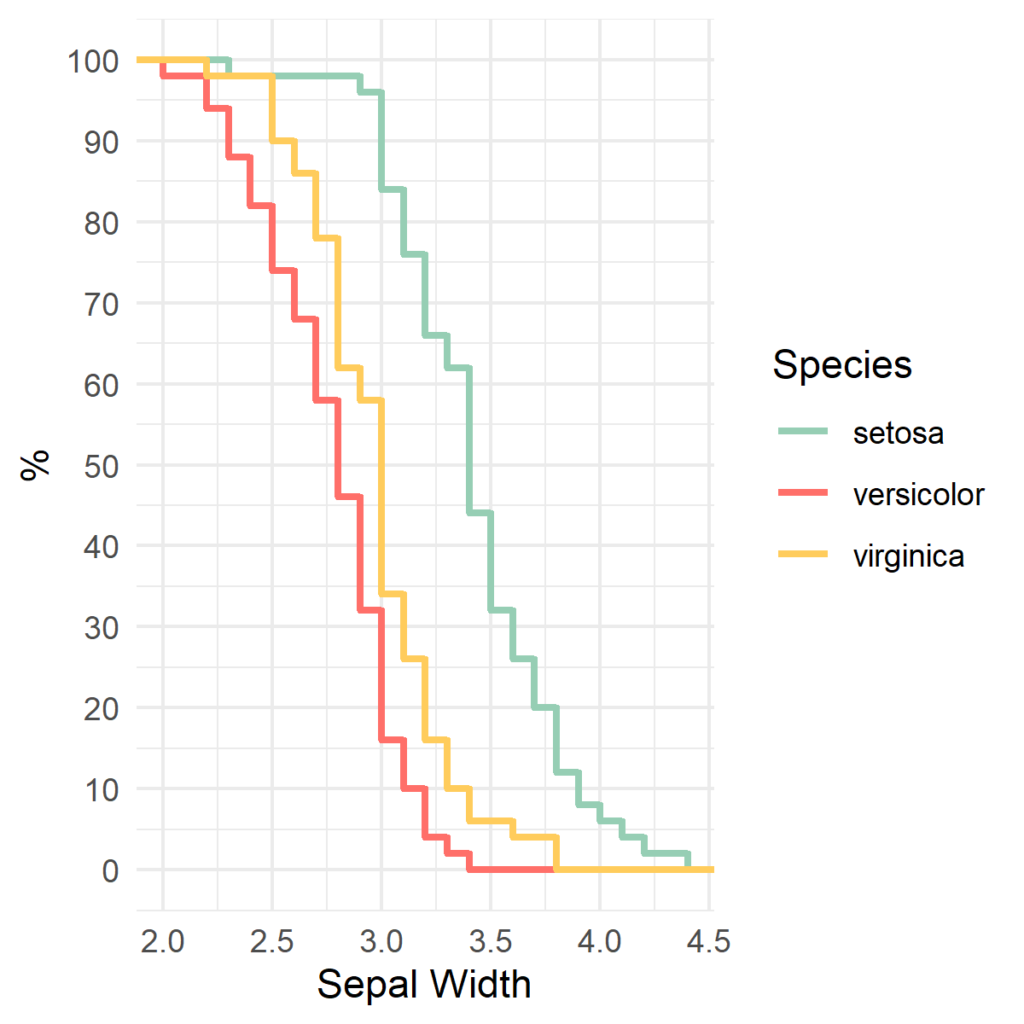 The focus of this page is to create cumulative frequency graphs in R using the stat_ecdf() function in the ggplot2 package, and the survfit() function…
 - How to Create a Histogram in R
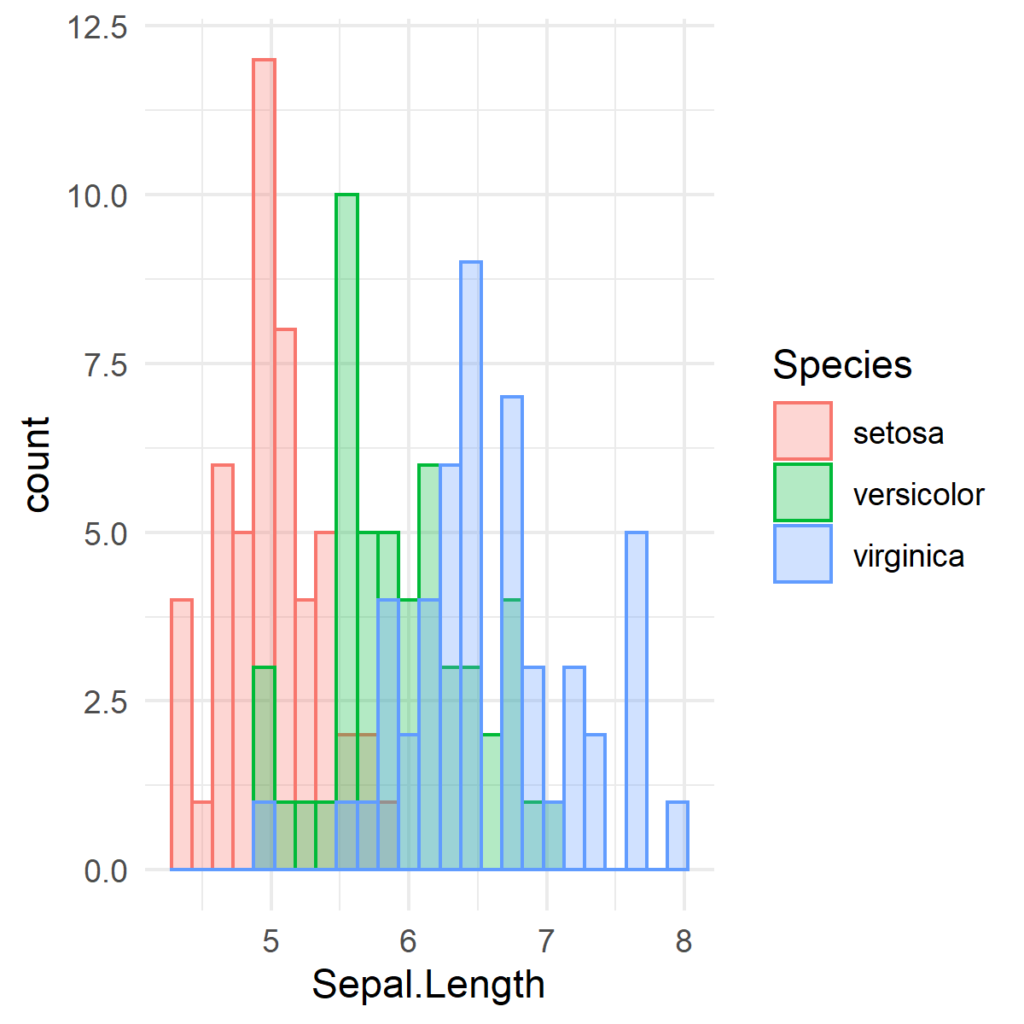 There are multiple ways to generate a histogram in R. The function hist() that comes in base R can be used to create a histogram,…
 - How to Create a Bar Graph in R
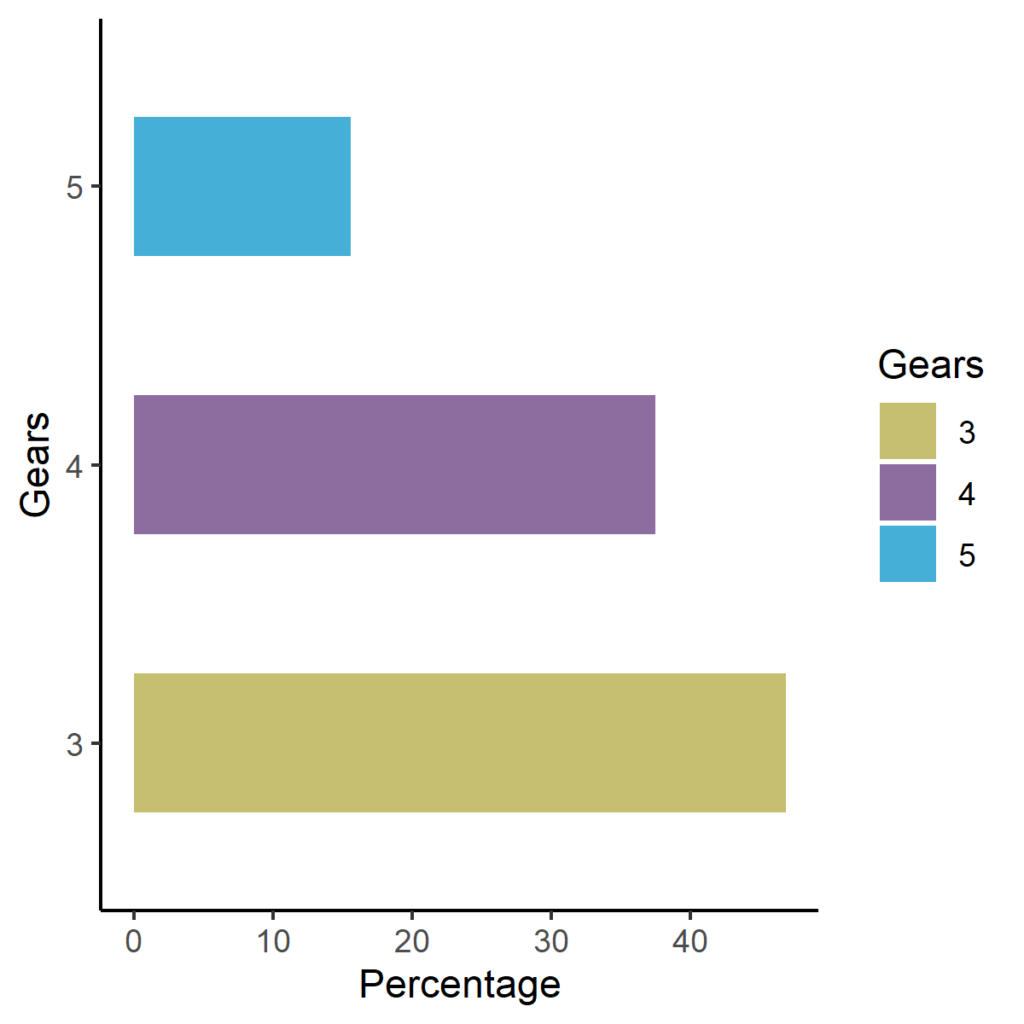 Bar graphs, also known as Bar charts, are one of the most commonly used methods of visualizing grouped data. The length of each bar represents…
 - How to Create a Scatterplot Matrix in R
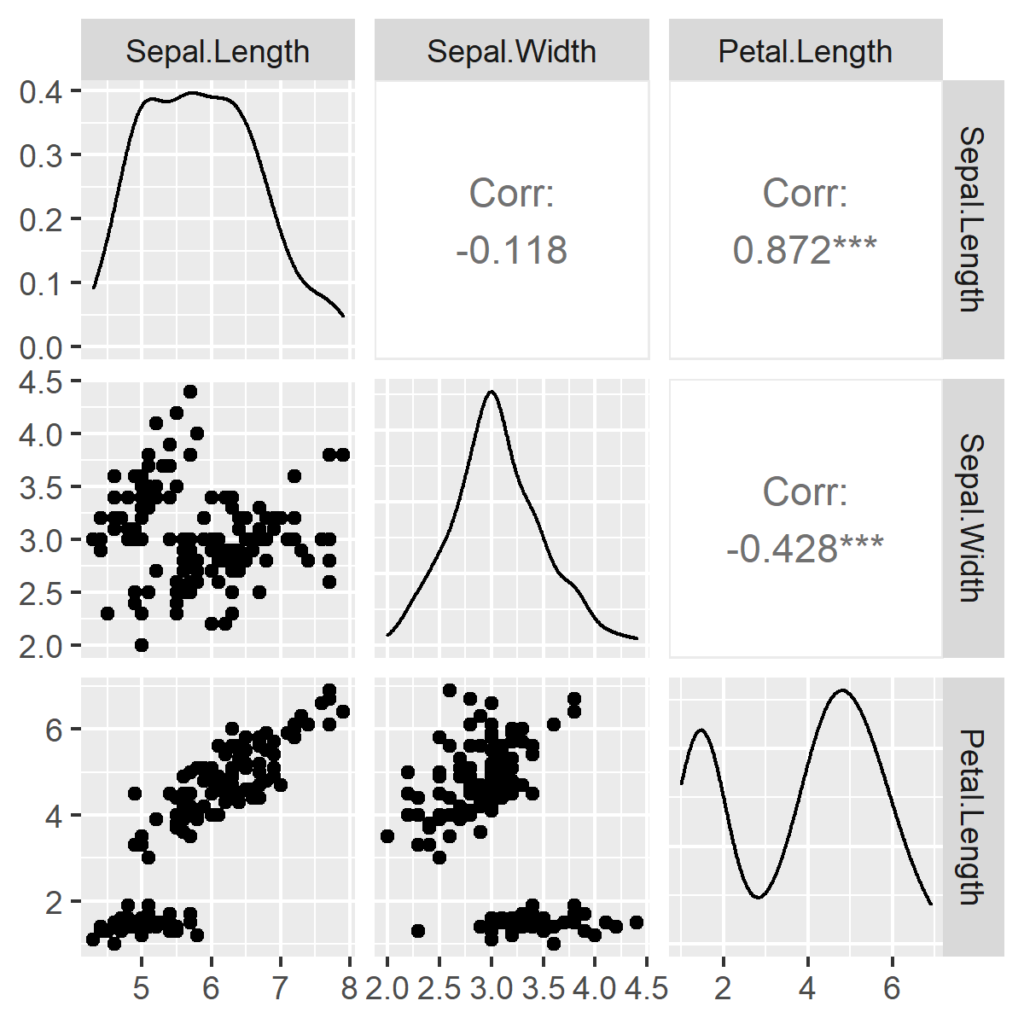 A scatterplot helps you visualize the relationship between two variables. When there are more than two variables and you would like to visualize the relationship…
 - How to Add a Regression Line to a Scatterplot in R
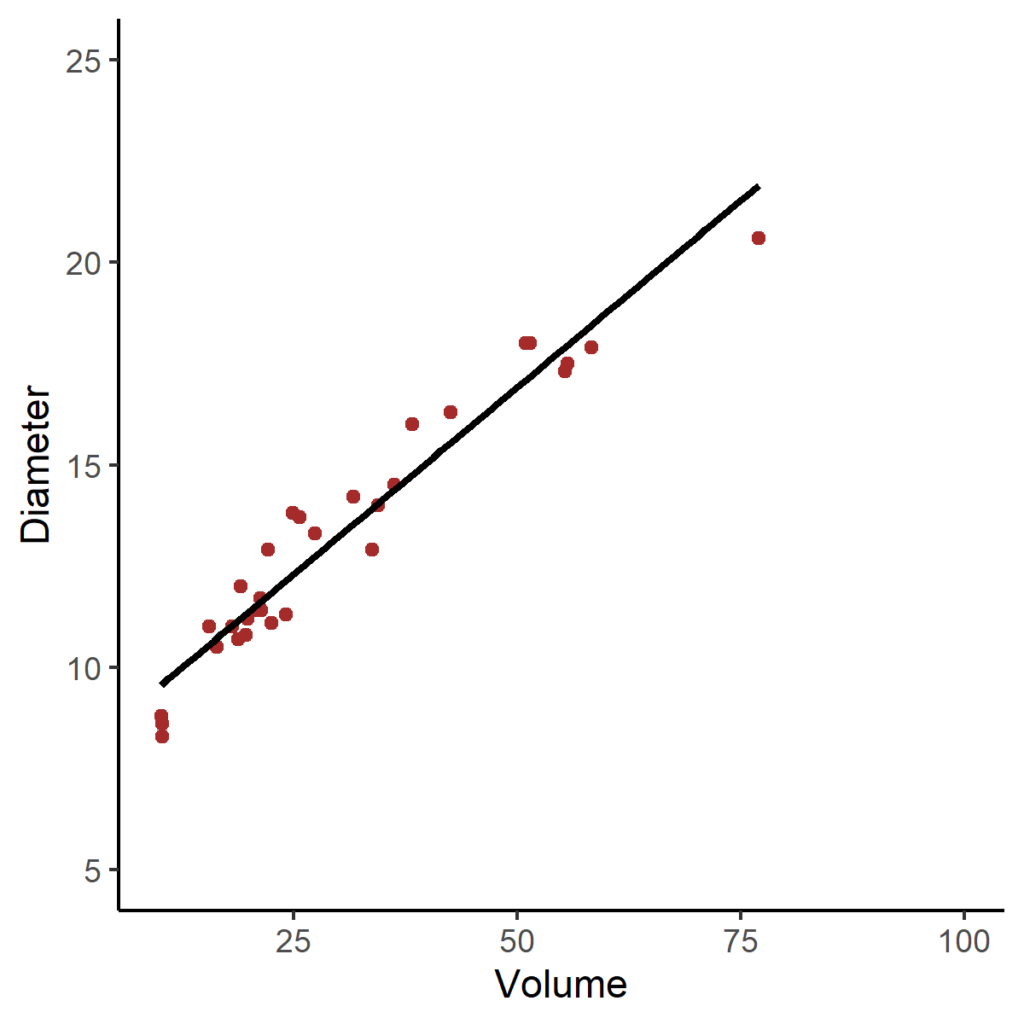 In a previous post, we described how to create a scatterplot plot in R. In the current post we will focus on fitting a regression…
 - How to Create a Scatterplot in R
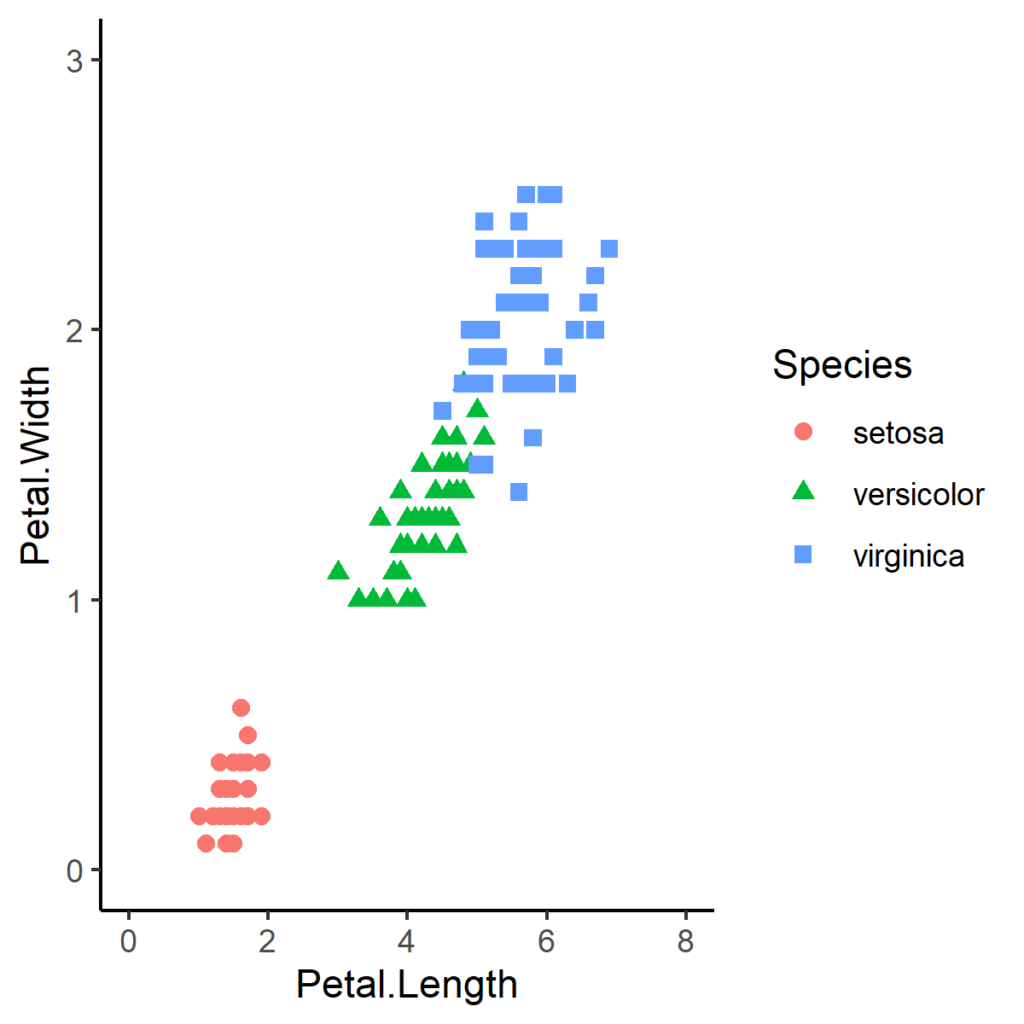 A scatterplot (also known as a correlation plot) is a graph used to visualize the relationship between two variables. When looking at a scatterplot, one…
 - Make a Boxplot in R Using Already Computed Statistics
 A boxplot is usually created from a continuous variable in a data frame. This is the preferred approach because it allows us to plot the…
 - How to Create a Boxplot in R
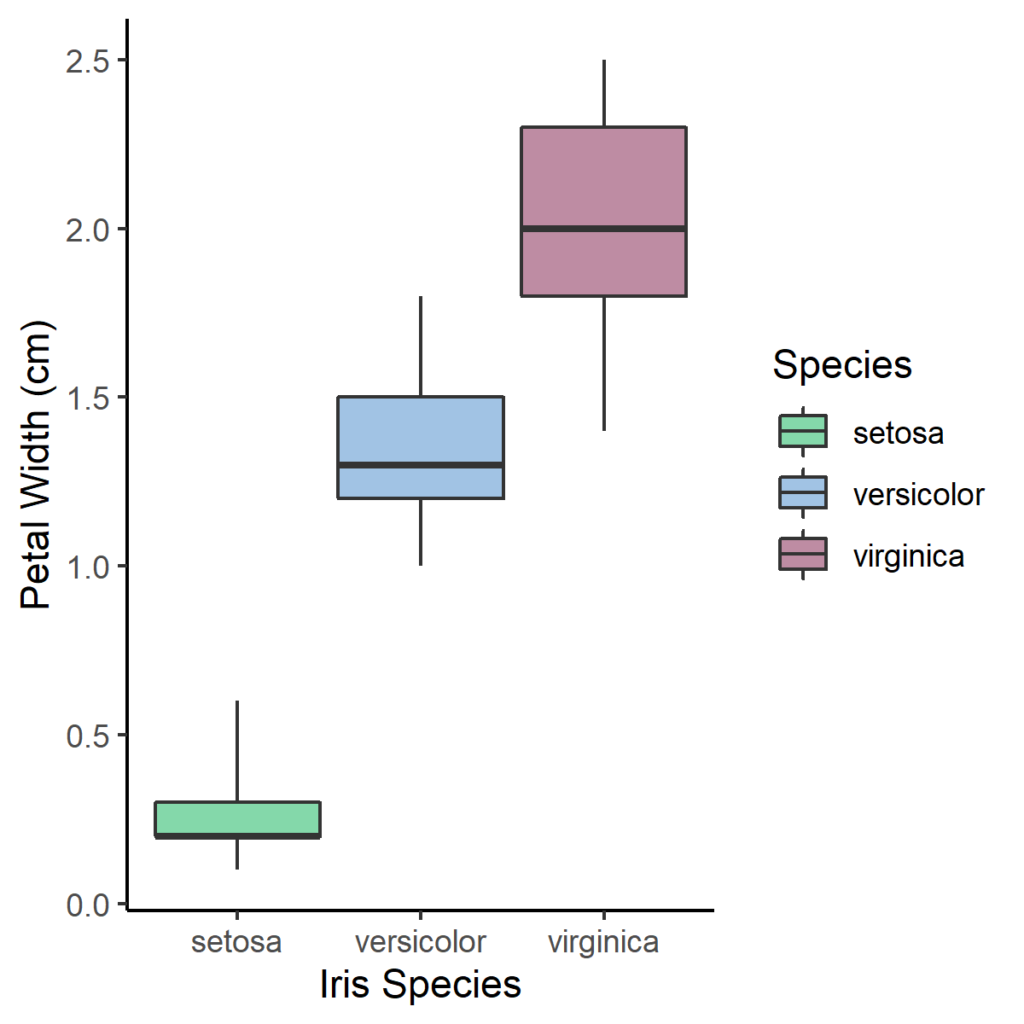
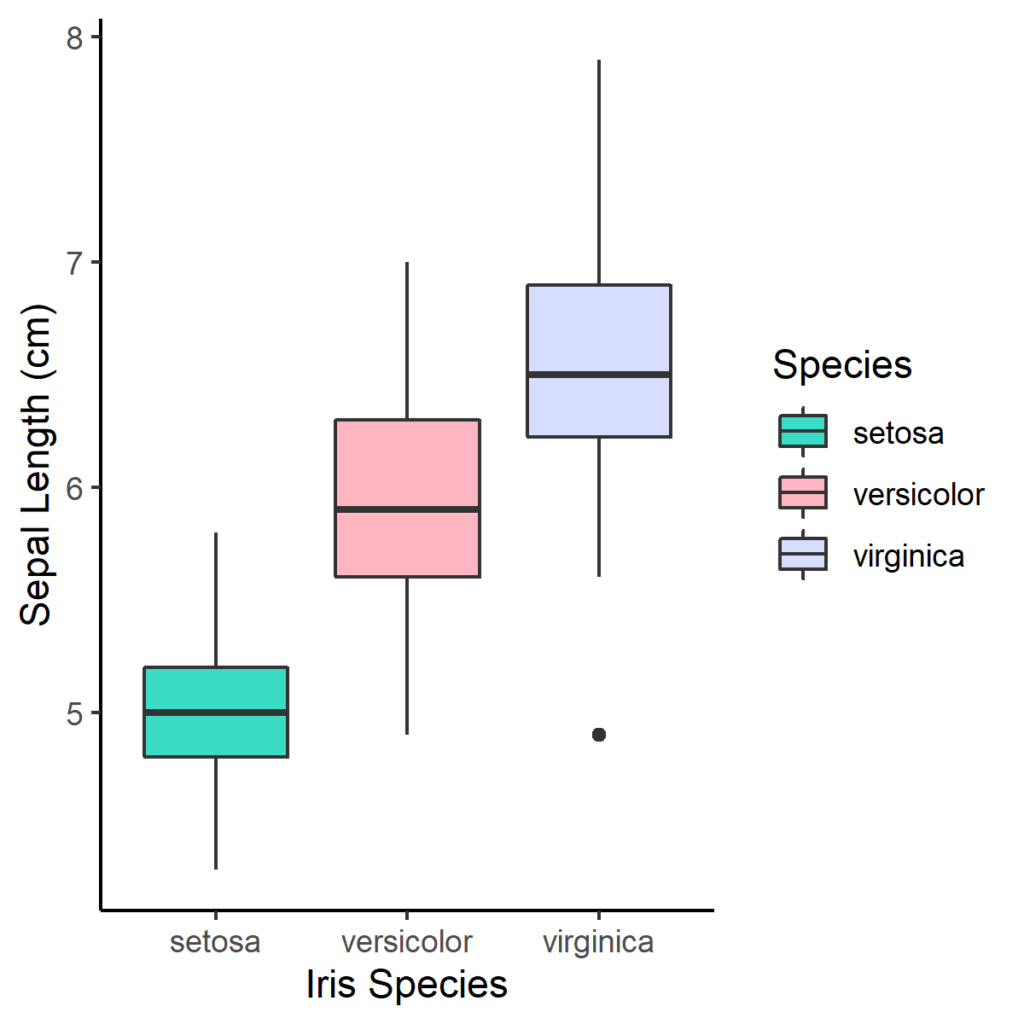 A boxplot (also known as box and whisker plot) shows the distribution of a continuous variable. It is a robust equivalent of the mean and…